
Debugging NodeJS using VS Code
In a previous article I wrote about NodeJS async and await, in which I used real world working examples and wrote/tested all code shown in the article as I was writing. While digging into these concepts I quickly realized that while writing code examples of any kind, I was going to need a debugger.
VS Code Debugging
I use VS Code to do 90% of all of my development, with VI being the other 10%. I run my node scripts in the terminal window using the node CLI command. Its only natural that I need to now debug this code right in VS Code.
Node Debug Plugin
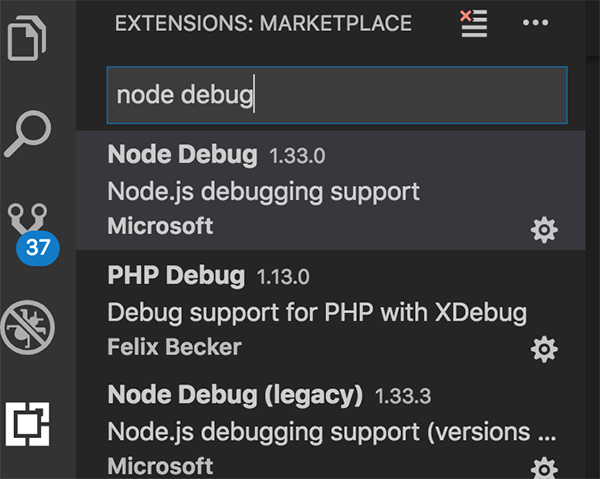
To ensure your VS Code can connect to a NodeJS debugging session, install Node Debug extension. Installing this extension, like any other extension in VS Code is pretty straightforward, click on the Extensions icon in the left menu, search for Node Debug and install.
Enabling Node Inspector
When running our commands in the terminal window with the node command, we can enable the inspector tool, which lets allows us to connect to our running NodeJS application with a debugging tool, such as Code. To run our index.js file, use the inspect option.
node --inspect index.js
Now we need an app that is constantly running. If the app isn’t running, and ends too soon, we can’t connect our debugger to it. Introducing an infinite loop will do the trick. I found this nifty code snippet on Stack Overflow>, and have updated my index.js to this:
index.js
function logEvery2Seconds(i) {
    setTimeout(() => {
        console.log('Infinite Loop Test n:', i);
        logEvery2Seconds(++i);
    }, 2000)
}

logEvery2Seconds(0);

let i = 0;
setInterval(() => {
    console.log('Infinite Loop Test interval n:', i++);
}, 2000)
And running index.js now gives me a running app that I can connect my debugger too:
node --inspect index.js
Debugger listening on ws://127.0.0.1:9229/68cf6bbe-86aa-4bf8-ae43-5e287dee7b8c
For help, see: https://nodejs.org/en/docs/inspector
Infinite Loop Test n: 0
Infinite Loop Test interval n: 0
Infinite Loop Test n: 1
Infinite Loop Test interval n: 1
Connecting NodeJS to VS Code
You can now listen to your NodeJS application in the VS Code debugger. Hit the debugging icon in the left column menu, and to add a NodeJS debugging option, click the down arrow and Add Configuration.
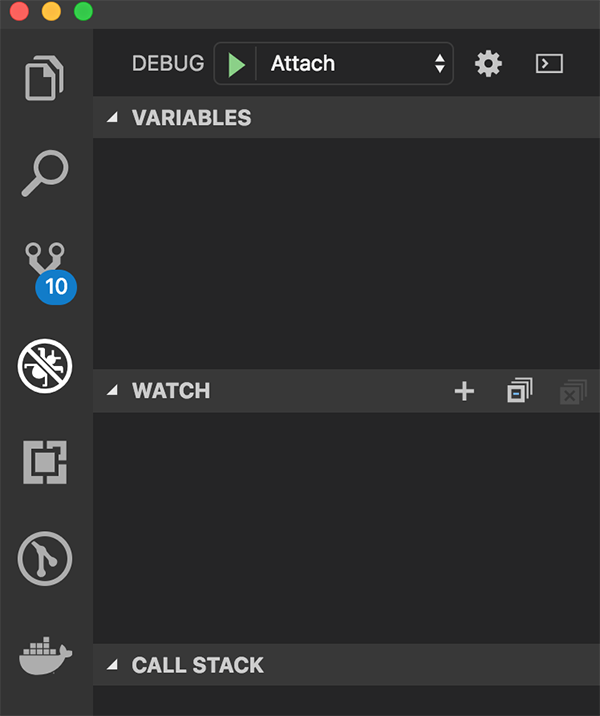
This will open the launch.json configuration file, with a list of debuggers to attach, select NodeJS: Attach it should insert a new debug option:
{
    "type": "node",
    "request": "attach",
    "name": "Attach",
    "port": 9229
}
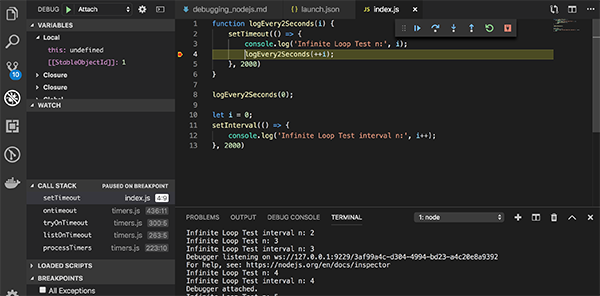
With your application running, click the play button in the debugger with your new listener attached. You should see the bottom status bar in VS Code turn orange and a your terminal should have a status message:
Debugger attached.
You can now use the debugging tools in VS Code to create breakpoints, step through code, and watch variables.
Bonus: Auto Attach
When you are working with debugging a lot, clicking on the debug icon, and clicking play each time you want to debug can be a pain. With the Node Debug extension we can automatically connect VS Code to our NodeJS application on run. To enable, visit Preferences -> Settings and search for node debug. Then under Extensions -> Node Debug, set Debug › Node: Auto Attach to On. Run your NodeJS application with –inspect again, and you’ll automatically be connected to the debugger.
References
- Official NodeJS Documentation: https://nodejs.org/en/docs/guides/debugging-getting-started/
- Infinite loops in NodeJS: https://stackoverflow.com/questions/45531690/how-to-create-an-infinite-loop-in-nodejs